
5 Pandas Techniques in Python
- tasnim assali
- Oct 30, 2021
- 2 min read

Updated: Nov 5, 2021
In this post, I will identify 5 useful pandas techniques in python to show its powerful tools. Each tool will be demonstrated with a brief definition and a simple code.
I started with importing the Pandas module and loading the data set into the Python environment as Pandas Dataframe:
import pandas as pd
import numpy as np
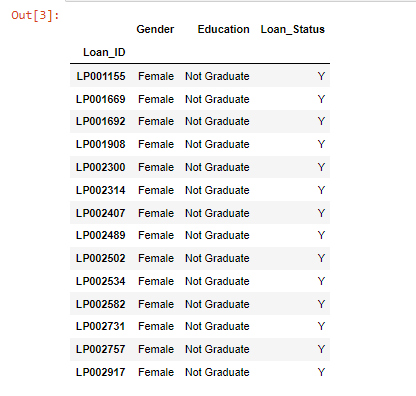
data = pd.read_csv("C:/Users/asus/Desktop/train.csv", index_col="Loan_ID")I will start with the first technique: Boolean indexing in pandas.
Boolean Indexing in Pandas
In order to filter values of a column based on conditions from another set of columns from a Pandas Dataframe, I want to list all females who are: not graduates and have a loan.
Therefore I used Boolean indexing that can help as shown in the following code:
data.loc[(data["Gender"]=="Female") & (data["Education"]=="Not Graduate") & (data["Loan_Status"]=="Y"), ["Gender","Education","Loan_Status"]]
This code gives the following result:
The second technique I used in this blog is Apply Function in pandas.
Apply Function in Pandas
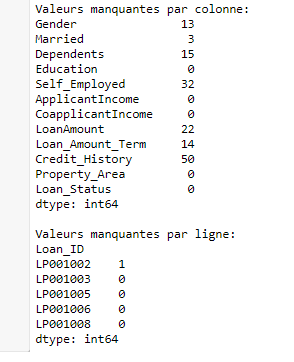
The function in Pandas returns the value after passing each row-column of a data frame after using one function or more. It can be default or user-defined. As shown in the code below:
#Apply Function in Pandas
def num_missing(x):
return sum(x.isnull())
print("Valeurs manquantes par colonne:")
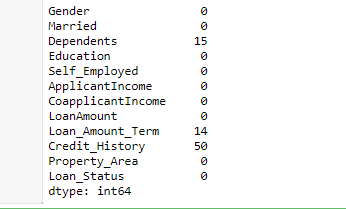
print(data.apply(num_missing, axis=0))
print("\nValeurs manquantes par ligne:")
print(data.apply(num_missing, axis=1).head())
This code gives the following result:
The Third Technique is Imputing missing values using Pandas.
Imputing missing values using Pandas
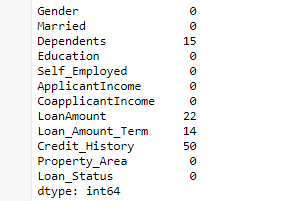
This technique is used to update missing values with the overall mean/mode/median of the column. In the code below I worked on the Gender, Married, and Self_Employed columns with their modes.
As shown in the code below:
#Imputing missing values using Pandas
from scipy.stats import mode
mode(data['Gender'])
data['Gender'].mode()[0]
data['Gender'].fillna(data['Gender'].mode().iloc[0], inplace=True)
data['Married'].fillna(data['Married'].mode().iloc[0], inplace=True)
data['Self_Employed'].fillna(data['Self_Employed'].mode().iloc[0], inplace=True)
print(data.apply(num_missing, axis=0))
This code gives the following result:
The 4th technique is the Pivot Table in Pandas
Pivot Table in Pandas
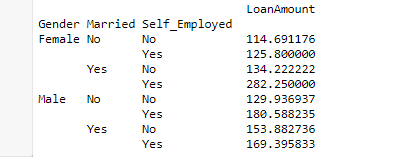
Pandas also can be used to create pivot tables when a key column is 'LoanAmount' that has missing values. impute it using the mean amount of each ‘Gender’, ‘Married’ and ‘Self_Employed’ group. The mean ‘LoanAmount’ of each group in Pandas data frame.
The code below shows how I implement it to determine a pivot table:
#Pivot Table in Pandas
impute_grps = data.pivot_table(values=["LoanAmount"], index=["Gender","Married","Self_Employed"], aggfunc=np.mean)
print (impute_grps)
This code gives the following result:
The last technique is the Multi-Indexing in Pandas Dataframe
Multi-Indexing in Pandas Dataframe
the Pandas index is made with a combination of 3 values called Multi-Indexing. It helps in performing operations and provides fast operations.
The values for each group have not been imputed.
I did it by using the various techniques from pandas learned till now.
As shown in the code below:
#Multi-Indexing in Pandas Dataframe
for i,row in data.loc[data['LoanAmount'].isnull(),:].iterrows():
  ind = tuple([row['Gender'],row['Married'],row['Self_Employed']])
  data.loc[i,'LoanAmount'] = impute_grps.loc[ind].values[0]
print (data.apply(num_missing, axis=0))
This code gives the following result:


You must write an original article or you should never post them on Data Insight.
65% of your article was plagiarized from these 10 sources:
1.This can be done using the various techniques from pandas learned till now. #iterate only through rows with missing LoanAmount for i,row in ...
https://www.analyticsvidhya.com/blog/2016/01/12-pandas-techniques-python-data-manipulation/
2.This article focuses on providing 12 ways for data manipulation in Python. Ive also shared some tips & tricks which will allow you to work faster. I would recommend that you look at the codes for data exploration before going ahead. To help you understand better, ...
https://www.scribd.com/doc/309584074/12-Useful-Pandas-Techniques-in-Python-for-Data-Manipulation
3.What do you do, if you want to filter values of a column based on conditions from another set of columns from a Pandas Dataframe? For instance, we want a list of all females who are not…